Deploying Microsoft Defender for Endpoint is one thing. Checking how it is configured on the device is another.
You might have your antivirus, attack surface reduction and endpoint detection policies assigned, but when it comes to troubleshooting or signing off a deployment, you still need to check what the endpoint is reporting. That can mean working through PowerShell output, registry settings and service status, then pulling it all together into something useful.
I built MDEValidator to make that process easier. In this post, I’ll cover what the module checks and how to get your first report up and running.
Table of contents
- What is MDEValidator?
- Getting started
- Turning the results into something useful
- A couple of things to keep in mind
- Give it a go
What is MDEValidator?
MDEValidator is an open-source PowerShell module for validating Microsoft Defender for Endpoint configurations and security settings on Windows endpoints. It brings a range of local checks together and returns consistent results, with explanations and recommendations where a setting needs attention.
The checks cover areas such as:
- Defender services, active or passive mode, and real-time protection.
- Cloud-delivered protection, sample submission and security intelligence updates.
- Network protection and attack surface reduction (ASR) rules.
- Tamper protection, exclusion visibility and local administrator exclusion merging.
- Microsoft Edge SmartScreen settings and Windows Server-specific options.
- MDE onboarding checks, when requested.
It reads the configuration and reports what it finds; it doesn’t change your Defender settings. That makes it useful for a quick troubleshooting session, a pilot deployment review, or documenting the state of a device before handover.
Getting started
You’ll need Windows 10/11 or Windows Server 2016 or later, PowerShell 5.1 or later, and Microsoft Defender Antivirus installed. Run the validation from an elevated PowerShell session for the fullest access to the checks.
The module is available on the PowerShell Gallery. Install it, import it, and run a report:
Install-Module -Name MDEValidator -Scope CurrentUser
Import-Module MDEValidator
Get-MDEValidationReport -IncludeOnboarding
-Scope CurrentUser installs the module for your account. The -IncludeOnboarding switch adds the local onboarding checks; you can leave it off for a standard configuration report.
Results are grouped into Pass, Fail, Warning, Info and NotApplicable. Read the messages alongside the status: an ASR rule in Audit mode, for example, might be intentional during a pilot, but still needs reviewing before you consider the rollout complete.
Turning the results into something useful
Create an HTML report
The console is handy for a quick check, but an HTML report is easier to review and share:
Get-MDEValidationReport -IncludeOnboarding `
    -OutputFormat HTML -OutputPath "C:\Reports\MDEReport.html"
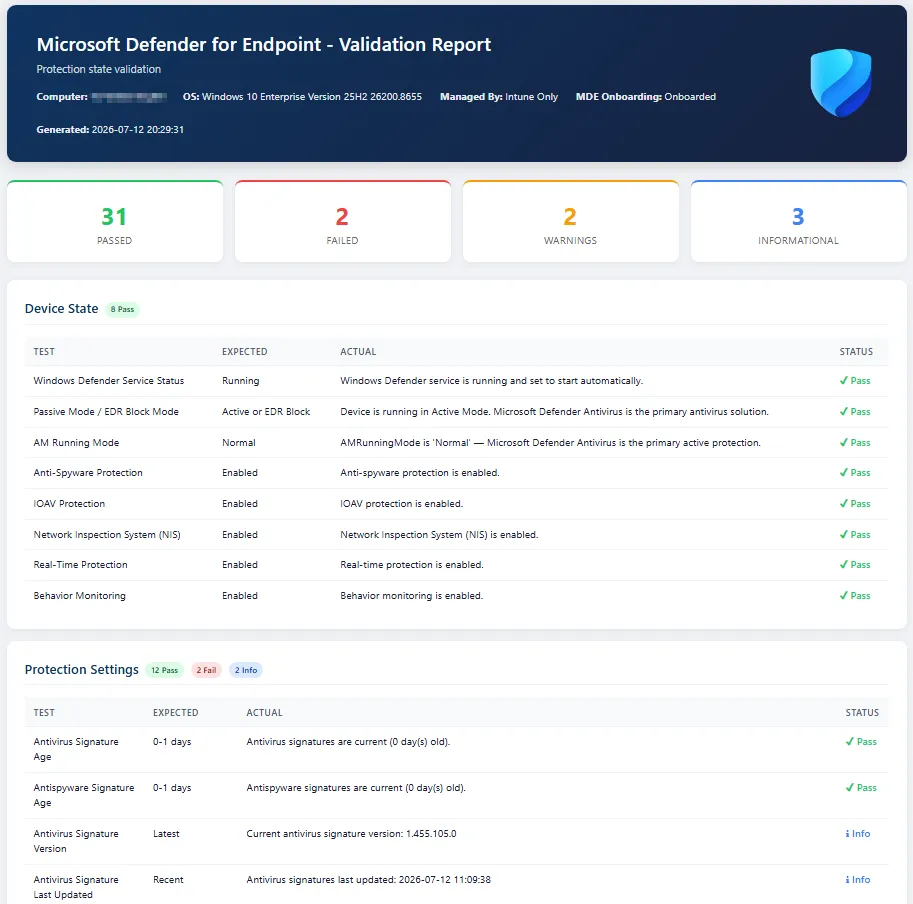
The report includes device information, summary cards and results grouped by category. You can click the status cards to filter the findings, making it easier to work through failures and warnings.
Focus on the settings you need
You can run individual checks or restrict a report to specific categories:
Test-MDERealTimeProtection
Get-MDEValidationReport -Category 'ASR Rules', 'Network Protection'
For scripting, return PowerShell objects and select the findings you want to investigate:
$results = Get-MDEValidationReport -OutputFormat Object
$results | Where-Object { $_.Status -in 'Fail', 'Warning' } |
    Select-Object TestName, Expected, Actual, Recommendation
JSON output is also available, and -AsExitCode returns the number of failed results for automation. A zero means there were no Fail results; warnings can still be present. PDF, Excel and Word exports are supported too, with Microsoft Edge, ImportExcel and PSWriteWord required respectively.
A couple of things to keep in mind
The results reflect the module’s built-in expectations, so review them against your own configuration requirements. A local report gives you useful evidence, but you’ll still want to check device health and reporting in the Defender portal.
There is also an optional -IncludePolicyVerification switch to inspect supporting policy registry entries. Intune’s HideExclusionsFromLocalAdmins setting can prevent access to the Defender Policy Manager registry path, which limits those checks even when running as administrator.
Give it a go
If you’re deploying or troubleshooting Defender, start with a report on a pilot device and work through the findings. The aim is to spend less time collecting settings and more time understanding what needs attention.
You can find the source, full usage examples and reporting options on GitHub. Feedback, issue reports and contributions are welcome!